Where the Money Is · Issue 01 · 14 October 2026
LVMH fell 5% in China. Uniqlo grew 11%. Same quarter.
Same country, same consumer, opposite results. The difference was who was deciding at the product-market level.
Two results landed this week.
LVMH's fashion and leather division fell 5% in the third quarter. Management pointed to China. Shares are down more than 40% this year.
Uniqlo's parent, Fast Retailing, reported Greater China revenue up 11% and profit up 25% for the year. Same country. Same consumer.
The easy read is "luxury is soft, mid-market is winning." That's a category story, and it's the wrong one.
Look at where each company actually made and lost money.
LVMH: Asia down 5%. The United States up 5%. The division number is the average of two different markets going in two different directions. The average is what got reported. The decision sits underneath it.
Uniqlo: grew China while closing stores there. 926 locations at the peak, 852 now. Fewer addresses, better ones. And for the first time, North America and Europe out-earned Greater China. The company moved its weight to where the return was, and it did it one market at a time.
Neither company's result is about the category. Both are about which product-markets carried the number, and whether anyone was deciding at that level.
This is the pattern in almost every company I've been in the room with.
Fifteen to twenty product-markets. Three or four make the money. Three or four lose it. The rest is noise.
The plan is written at the division. The P&L is reported at the division. So the division average is what the board sees, and the three cells doing the work and the three cells doing the damage cancel each other out on the page.
A 5% miss in China and a 5% gain in the US add up to a headline. They don't add up to a decision.
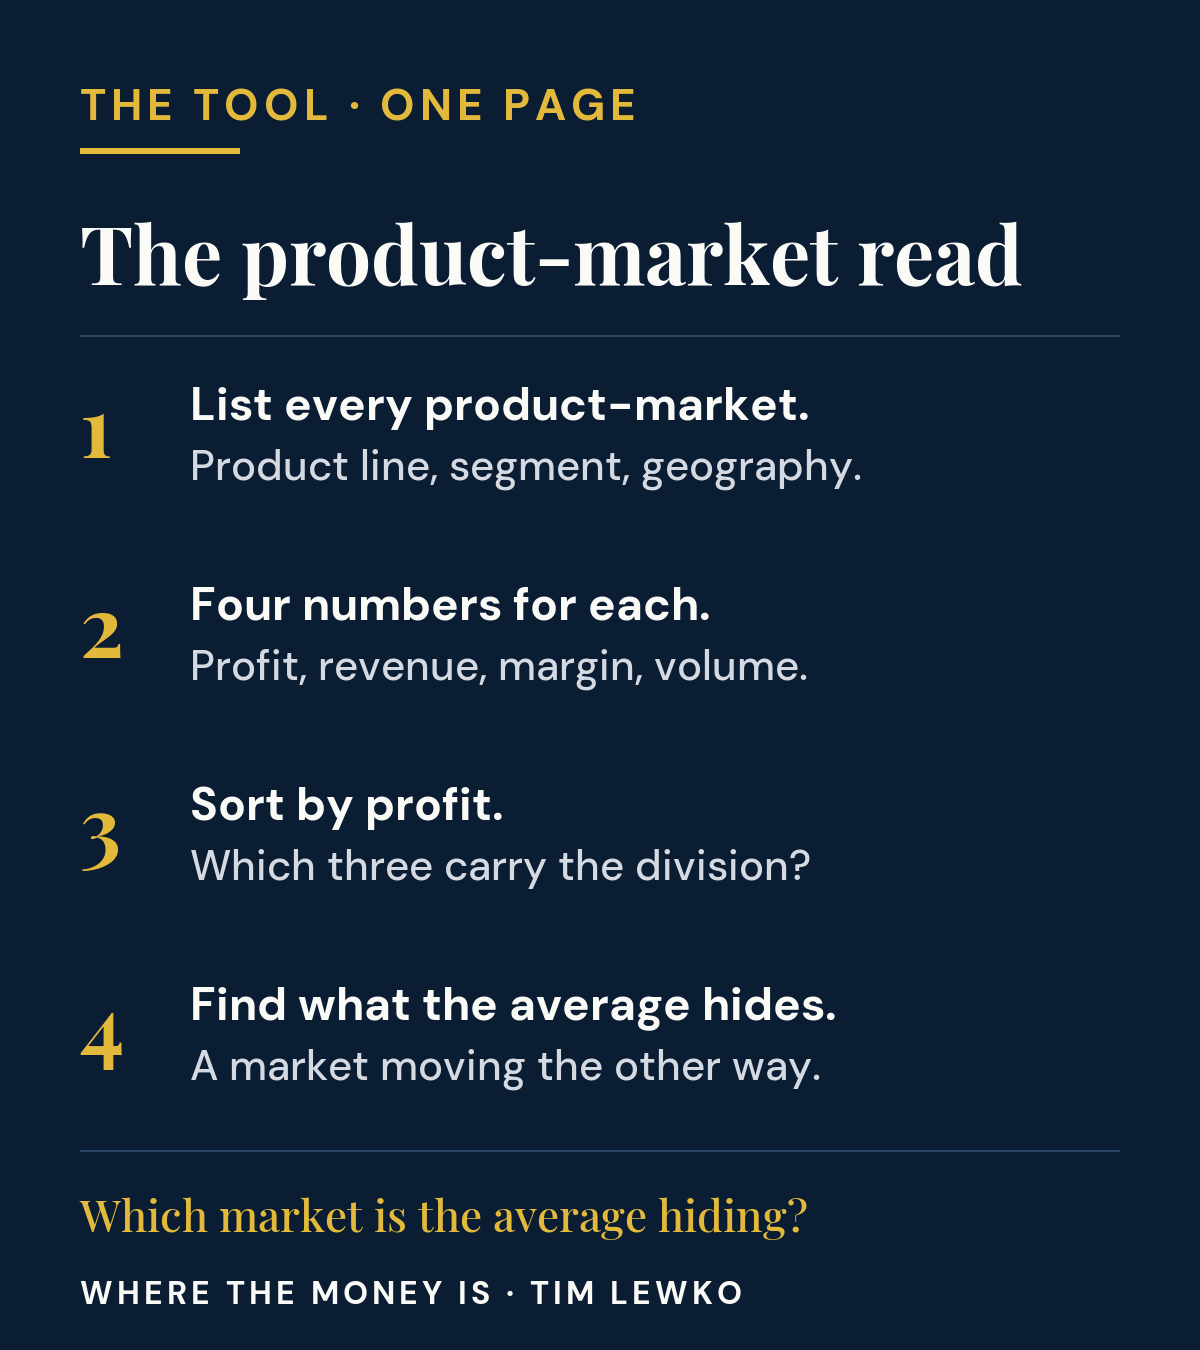
The tool
The product-market read
Take your largest division. List its product-markets: a product line, in a customer segment, in a geography. Ten to twenty rows.
For each row, four numbers: profit, revenue, margin, volume. Last twelve months.
Then sort by profit.
Three questions:
- Which three rows carry the division? Does each have a named owner?
- Which rows lose money with no advantage you can build? What would stop if you exited them?
- Where is the division average hiding a market that's moving the other way?
One page. Half a day with the finance team. It is the first thing the system I use, MOVE®, asks for, and it is the page many companies have never built.
Forward this to your CFO.
Which of our markets is the average hiding?
Tim
Tim Lewko is the author of MOVE (Routledge) and CEO of Thinking Dimensions Global. Twenty-five years, 100+ CEO engagements, $2B+ in client EBITDA. tlewko@thinkingdimensions.ca
Sources: LVMH Q3 2026 results; Fast Retailing FY2026 results, 8 October 2026.
Talk to Tim.
A short note about the decision in front of you is enough. Tim replies personally.
Or ask for a one-page view of your business, from public data, the same day.
MOVE® is available to license, embed or own. License MOVE · Tim is CEO of Thinking Dimensions Global